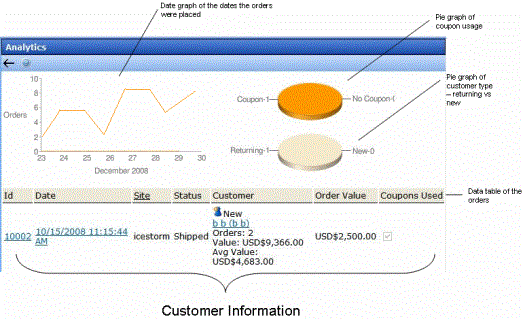
The eCommerce Analytics screen provides a visual display of order information for a selected catalog entry.

The top left section graphs the quantity of this catalog entry ordered over the past seven days
The top right charts the number of orders that used a coupon versus the number that did not
Below that pie chart is another that shows the number of returning customers versus the number of new ones
The lower part of the screen shows the following order information
- order number
- date/time when order was entered
- site from which order was entered
- order status
- customer information: new or returning, name, number of orders entered, value of all orders entered, average order monetary value
- order monetary value
- whether or not a coupon was used


